Icing
AERODYNAMIC RISKS OF GROUND ICING
The micro-structure of ice on aircraft surfaces compromises macroscopic flight parameters:
lift degradation, a spike in drag, accelerated stall onset, and erroneous sensor readings.
Accretion
Impact
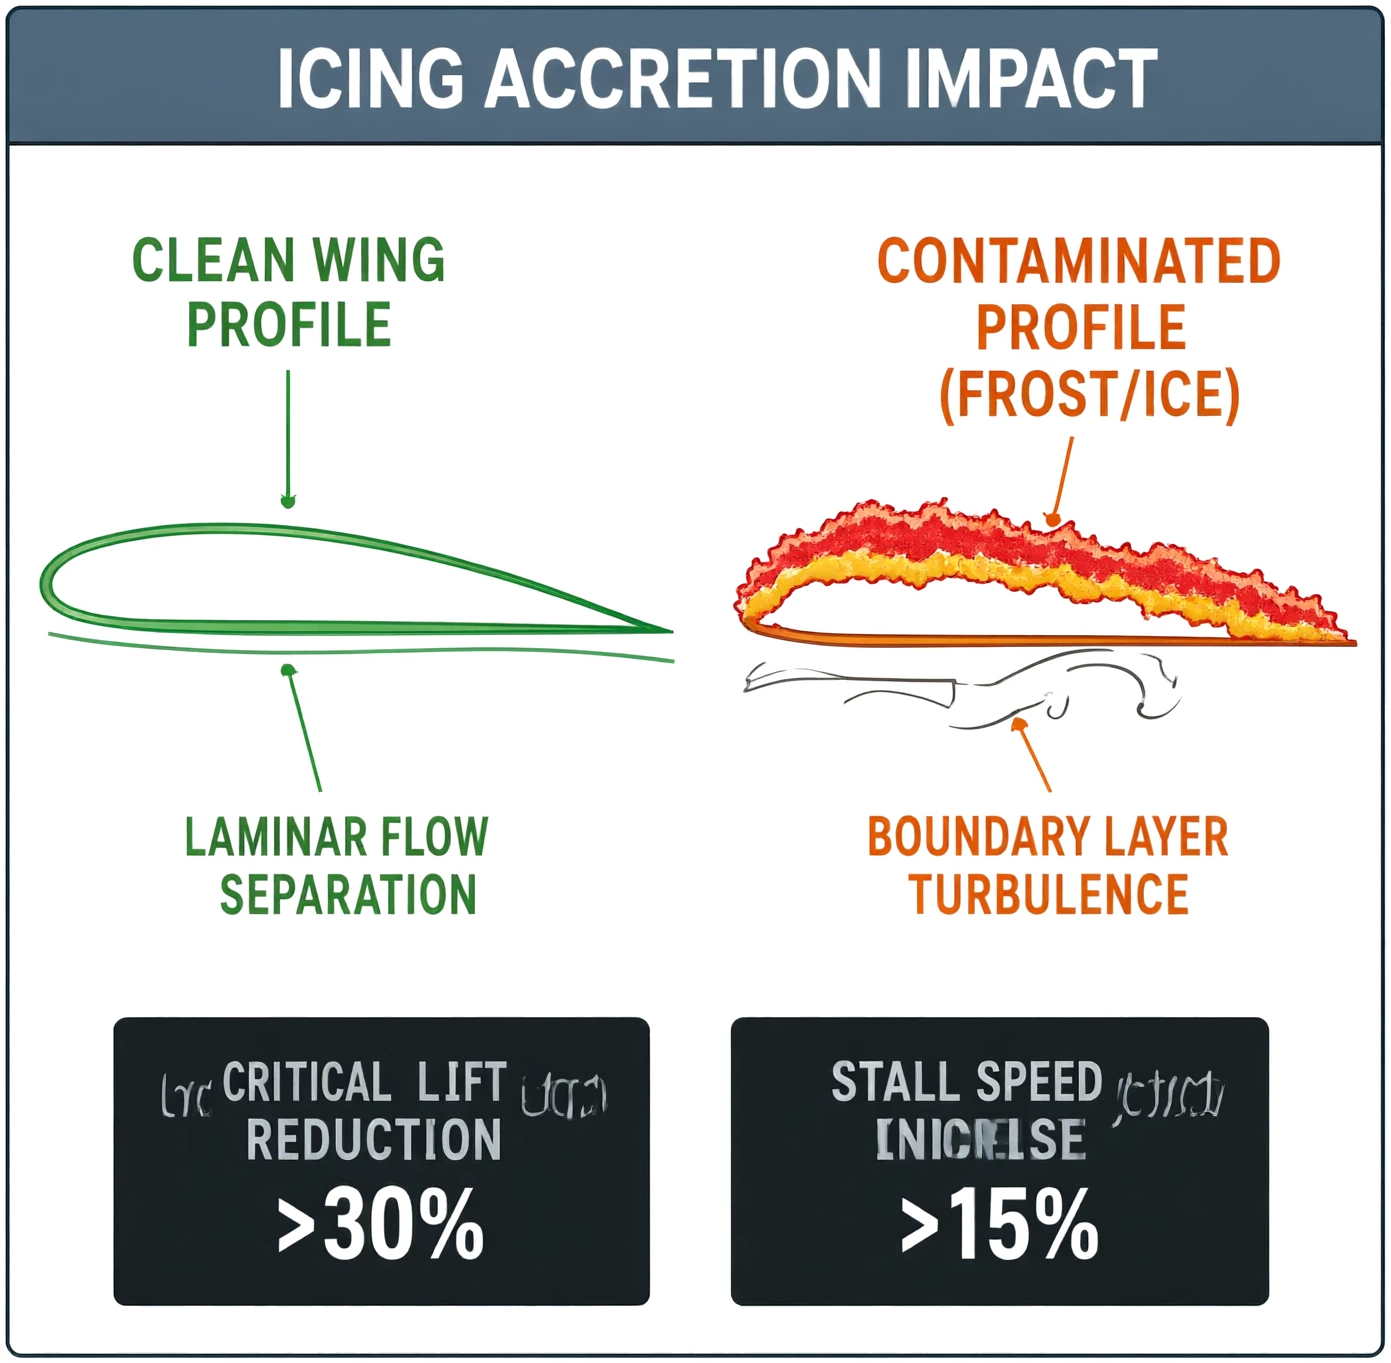
Comparison of clean versus ice-contaminated airfoil cross-sections: transition from laminar flow separation to turbulent boundary layer, resulting in a critical reduction in lift. >30% and STALL SPEED INCREASE >15%.
Degradation
Curve
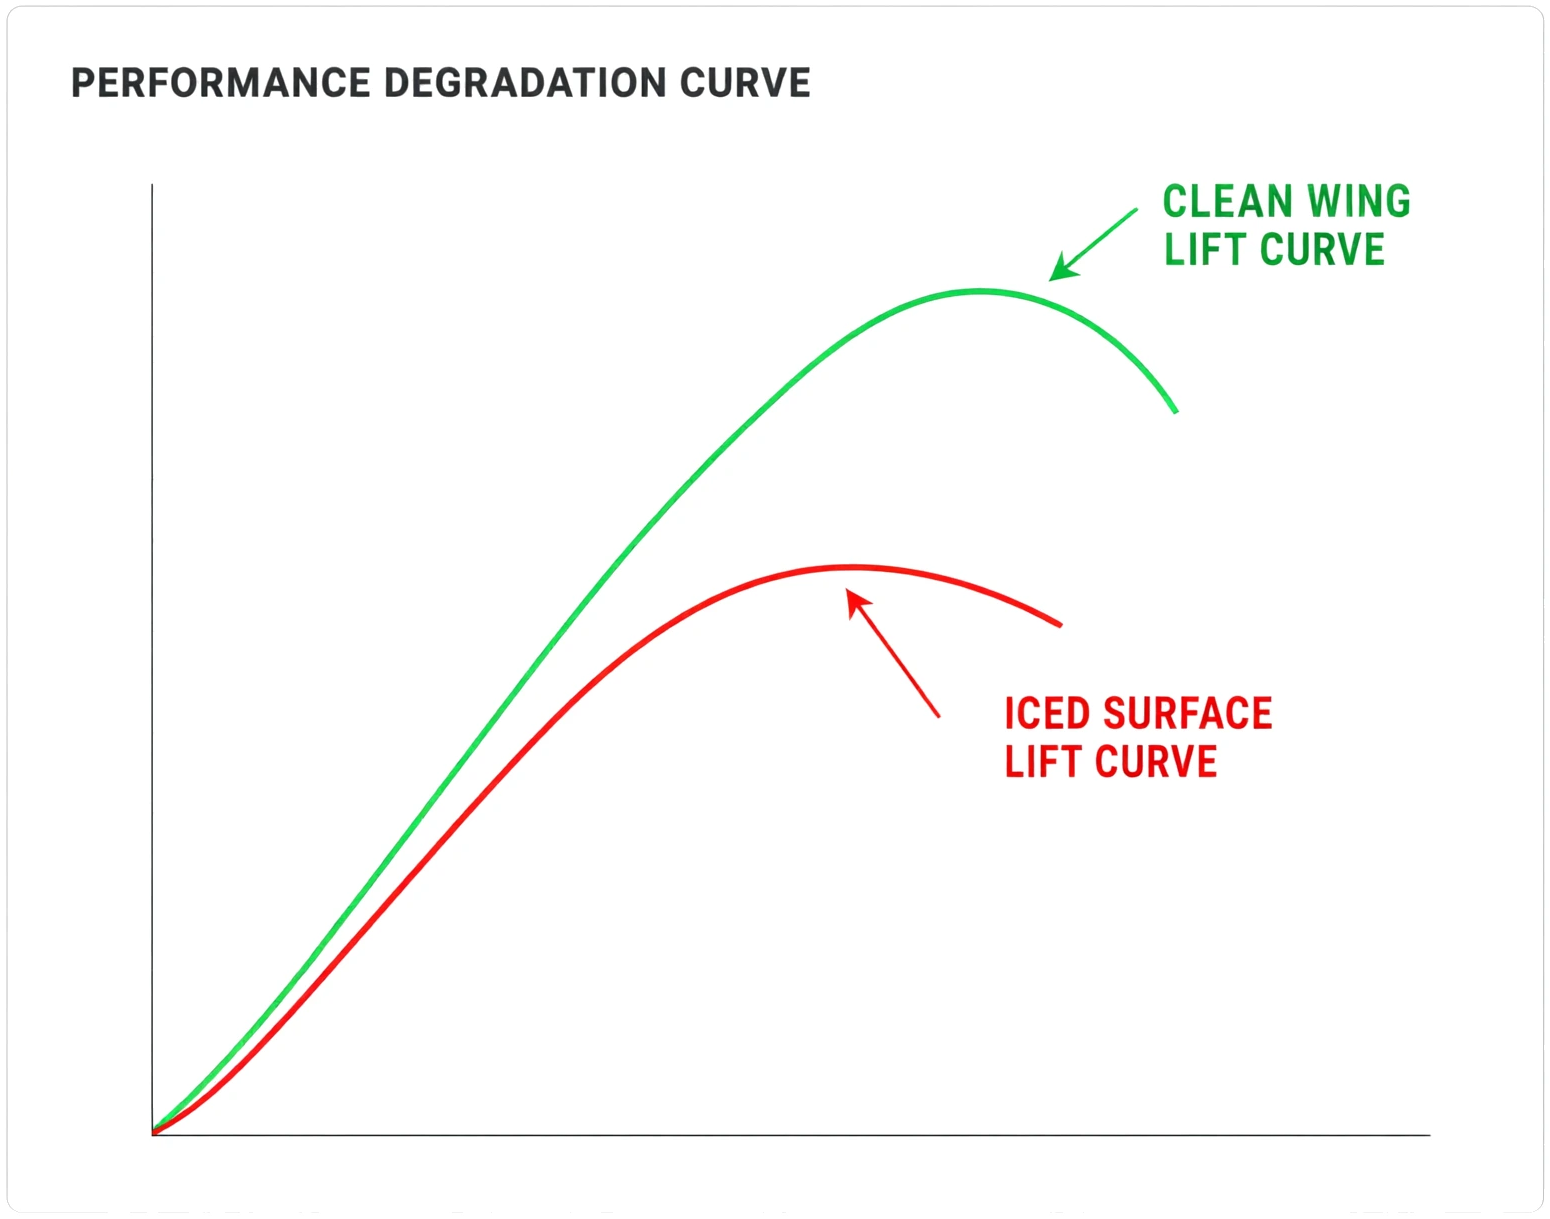
The lift vs AOA curve compares a clean wing (green) with a clean surface (red) that peaks earlier and lower.
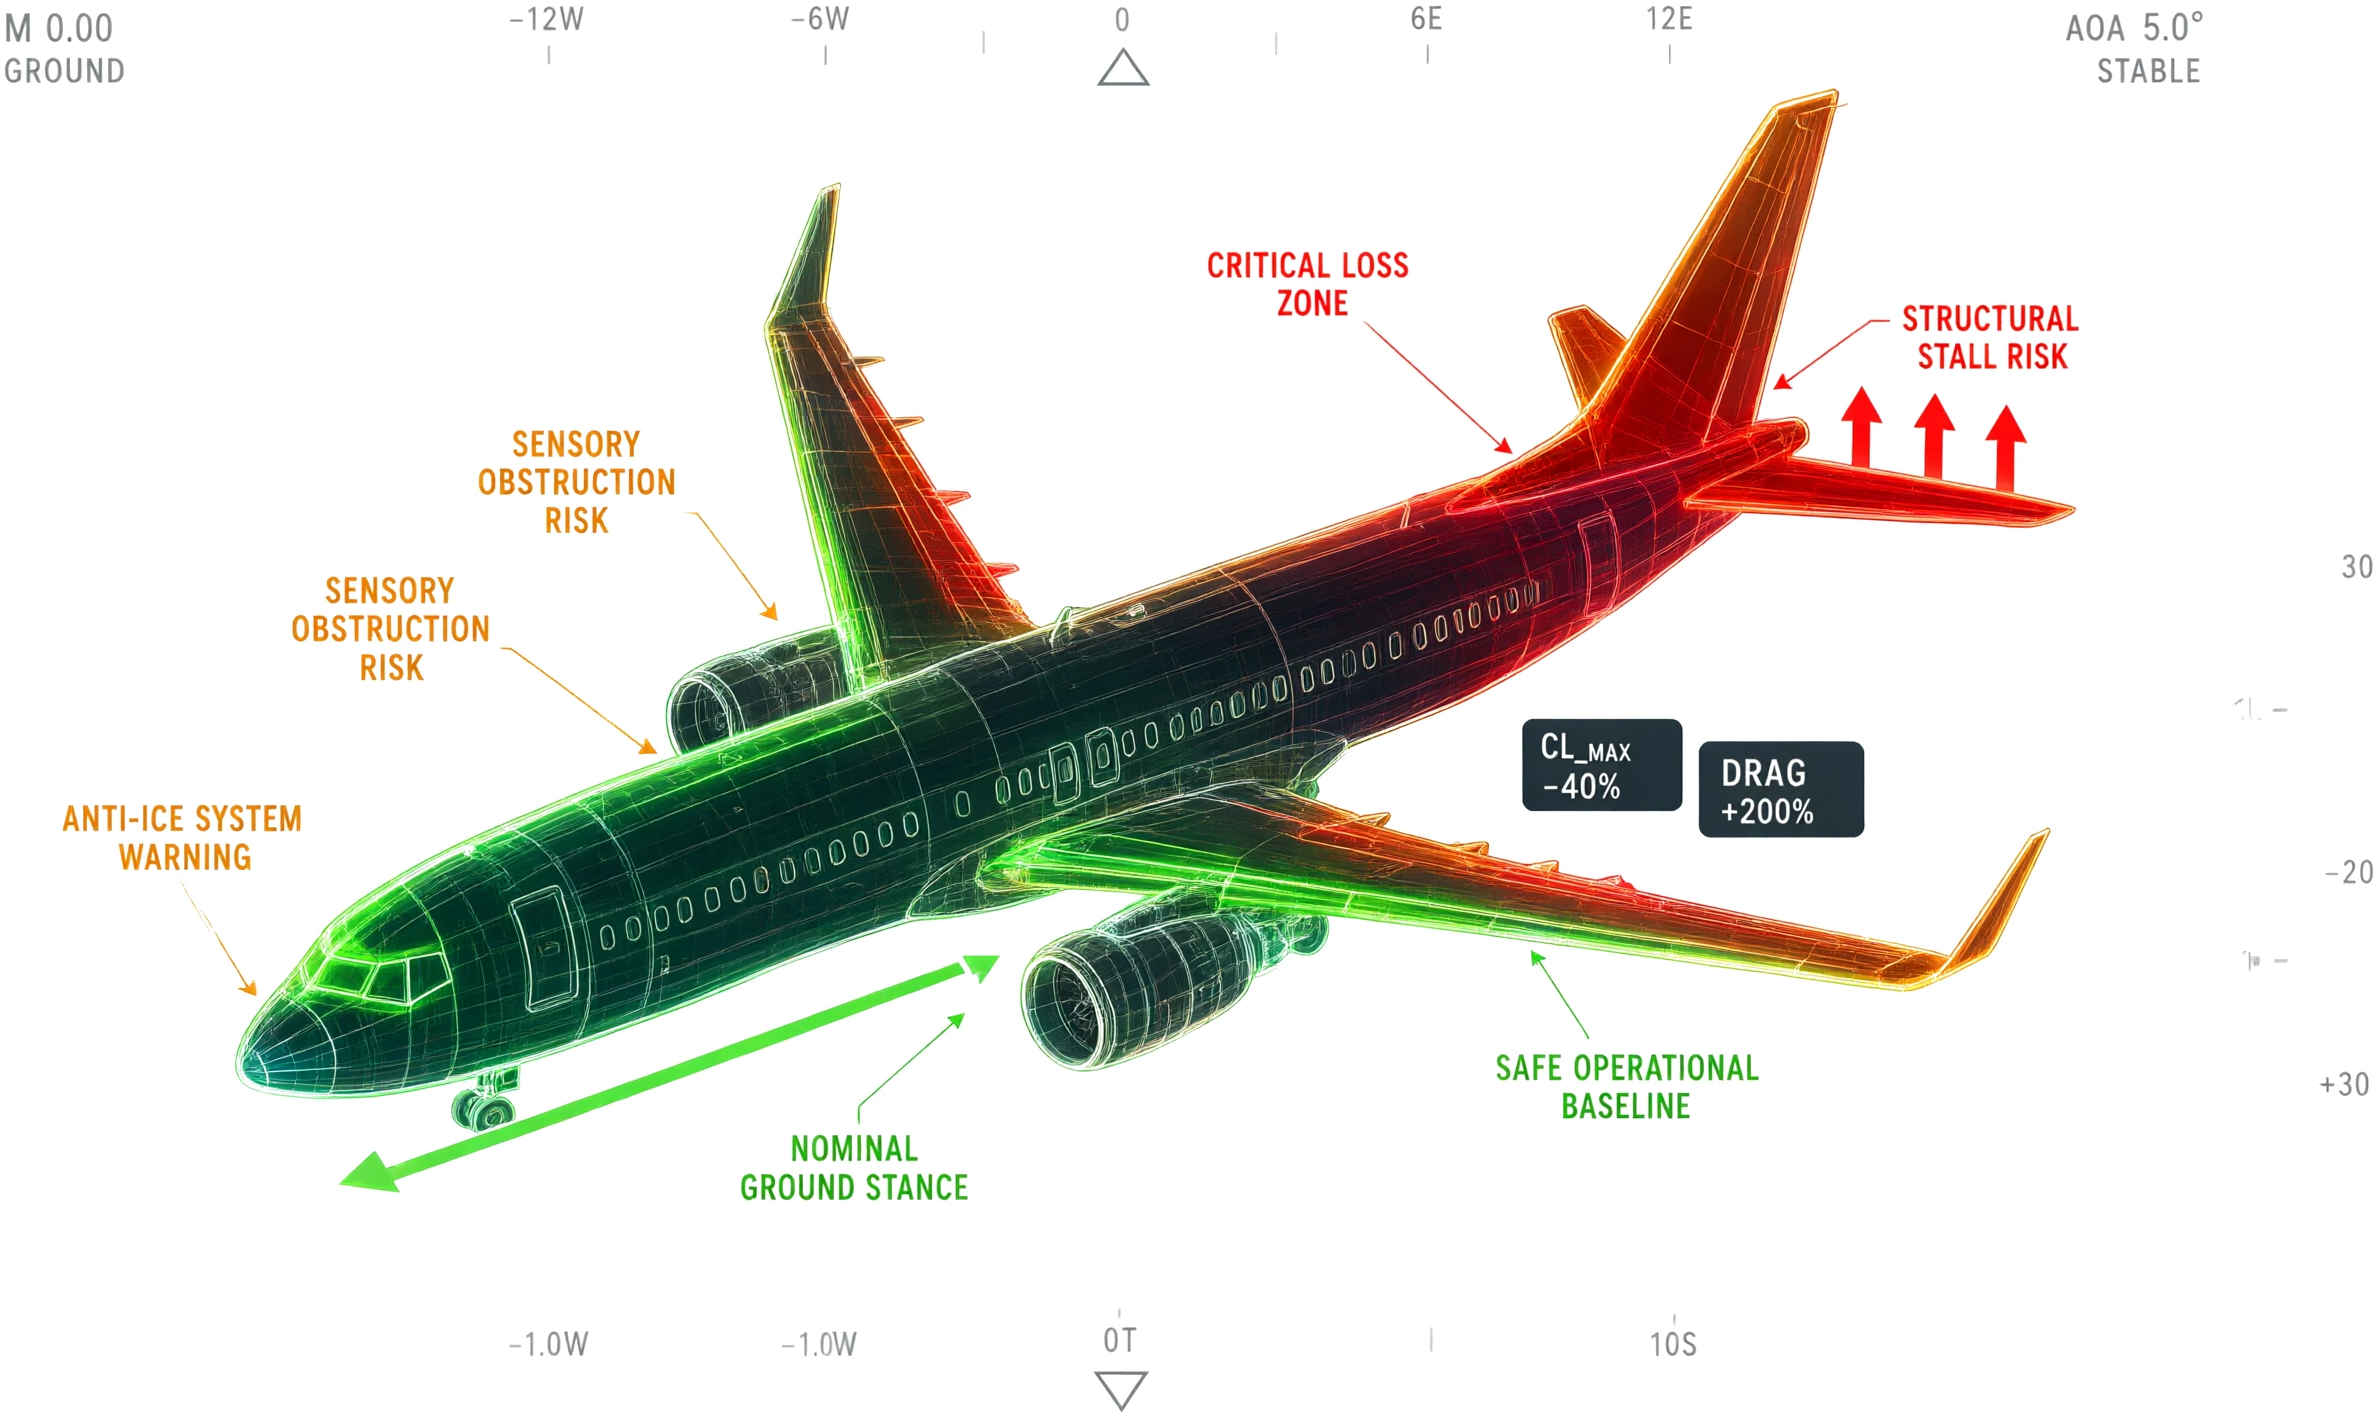
Isometric wireframe of a twin-engine aircraft with risk zone annotations: green marks the SAFE OPERATIONAL BASELINE, while red/orange mark the CRITICAL LOSS ZONE and STRUCTURAL STALL RISK. A HUD overlay displays M 0.00 GROUND, AOA 5.0° STABLE, as well as a CL_MAX degradation of -40% and a DRAG increase of +200%.
Warnings
Limits
01
Takeoff with frost, ice, or snow on critical surfaces is prohibited.
02
Aircraft performance becomes unpredictable when ice contamination occurs.
03
De-icing procedures must be performed prior to departure.
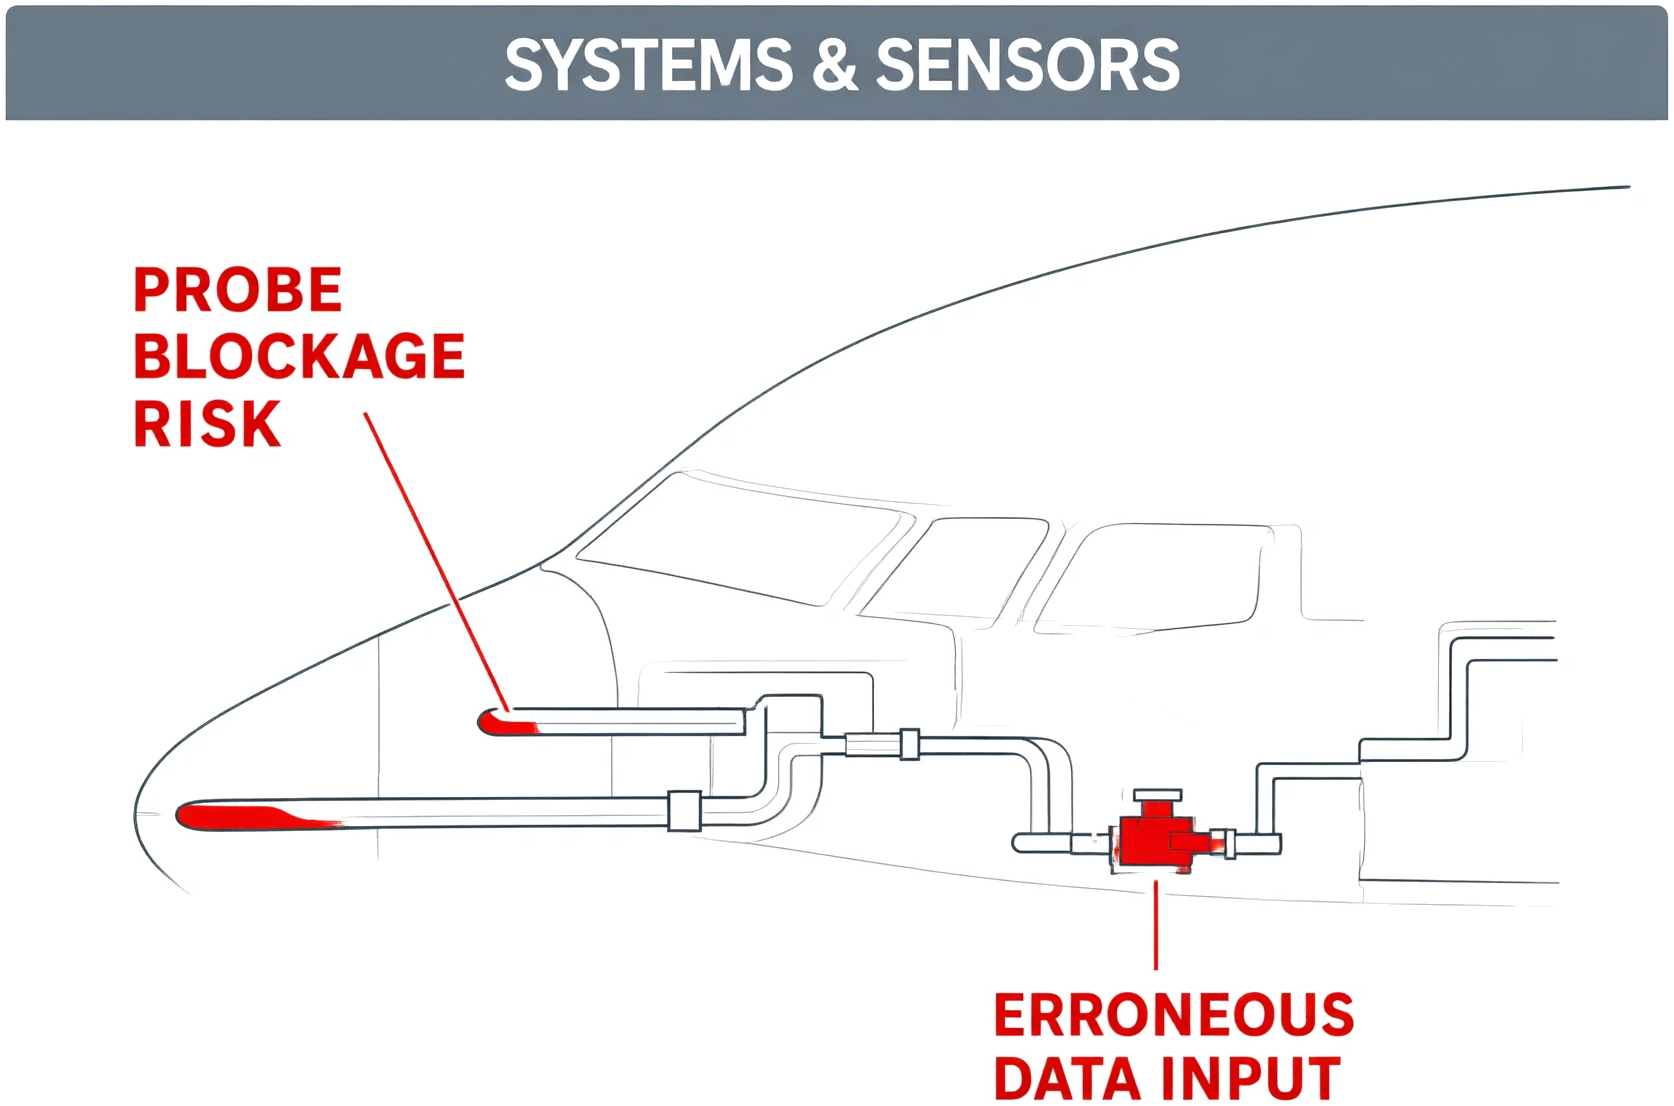
Skematik hidung pesawat dengan probe pitot/statis menandai PROBE BLOCKAGE RISK dan ERRONEOUS DATA INPUT akibat kontaminasi es.